

Using Tracking & Event Data from SkillCorner to Quantify Offensive Crashing
.
About The Partnership
In 2026, the University of Florida joined forces with SkillCorner, bringing AI-powered broadcast tracking data to the 2025 National Champion Gators men's basketball program. The partnership goes beyond the court: SkillCorner tracking and Dynamic Events data is put to work by student and faculty analysts within the UF Sports Analytics Lab, turning real coaching staff questions into production-ready analysis and preparing the next generation of basketball analysts along the way.
This case study, written by the UF Sports Analytics Lab, shows what that looks like in practice. Faced with a question no box score can answer, the lab used SkillCorner data to build a model that classifies offensive crashing on every shot, validated it against film, and delivered it straight into Florida's scouting workflow.
The Case Study, In The Lab's Own Words
The following was written by the UF Sports Analytics Lab and is presented in full.
Offensive rebounding percentage is one of basketball's Four Factors and an important component of offensive production. It measures the percentage of available missed shots your team rebounds while on offense. Traditional statistics, like rebounds and second-chance points, are effective at measuring the result of this process. What these statistics miss, however, are the actions before the rebound.
Before a player can secure an offensive rebound, they first must make the decision to crash. Crashing is the act of pursuing rebounds as players move toward the rim in effort to keep the possession alive and earn second-chance points.
At the University of Florida (UF) Sports Analytics Lab (UFSAL), we wanted to better understand the art of crashing. Our question was simple: Can we objectively identify when a player crashes the offensive glass and measure how effective they are when they do?
Moving Beyond Offensive Rebound Percentage
Before tracking data, evaluating crashing behavior relied heavily on film review. Anyone can watch a possession and identify whether a player pursued the offensive glass, but manually reviewing every shot, player, game, and opponent is time consuming.
Box score data alone cannot solve this problem, nor can play-by-play (PBP) data. An offensive rebound tells us who ultimately gained possession of the ball, but it does not identify every player involved in attacking the glass. A player may make an aggressive crash, occupying a defender and creating an opportunity for a teammate to grab the ball without ever being credited with a rebound.
To understand the process behind offensive rebounding, we needed to measure player movement. SkillCorner tracking and event data provided the foundation to do so.
Turning Tracking Data into a Basketball Court
Using SkillCorner player tracking data, our team developed a way to convert raw tracking coordinates into a two-dimensional visual representation of the basketball court.
This allows us to recreate player locations and movement throughout a possession and measure those movements relative to basketball-specific regions while creating a key to highlight SkillCorner dynamic event data such as drives, dribbles, closeouts, shots, and more.
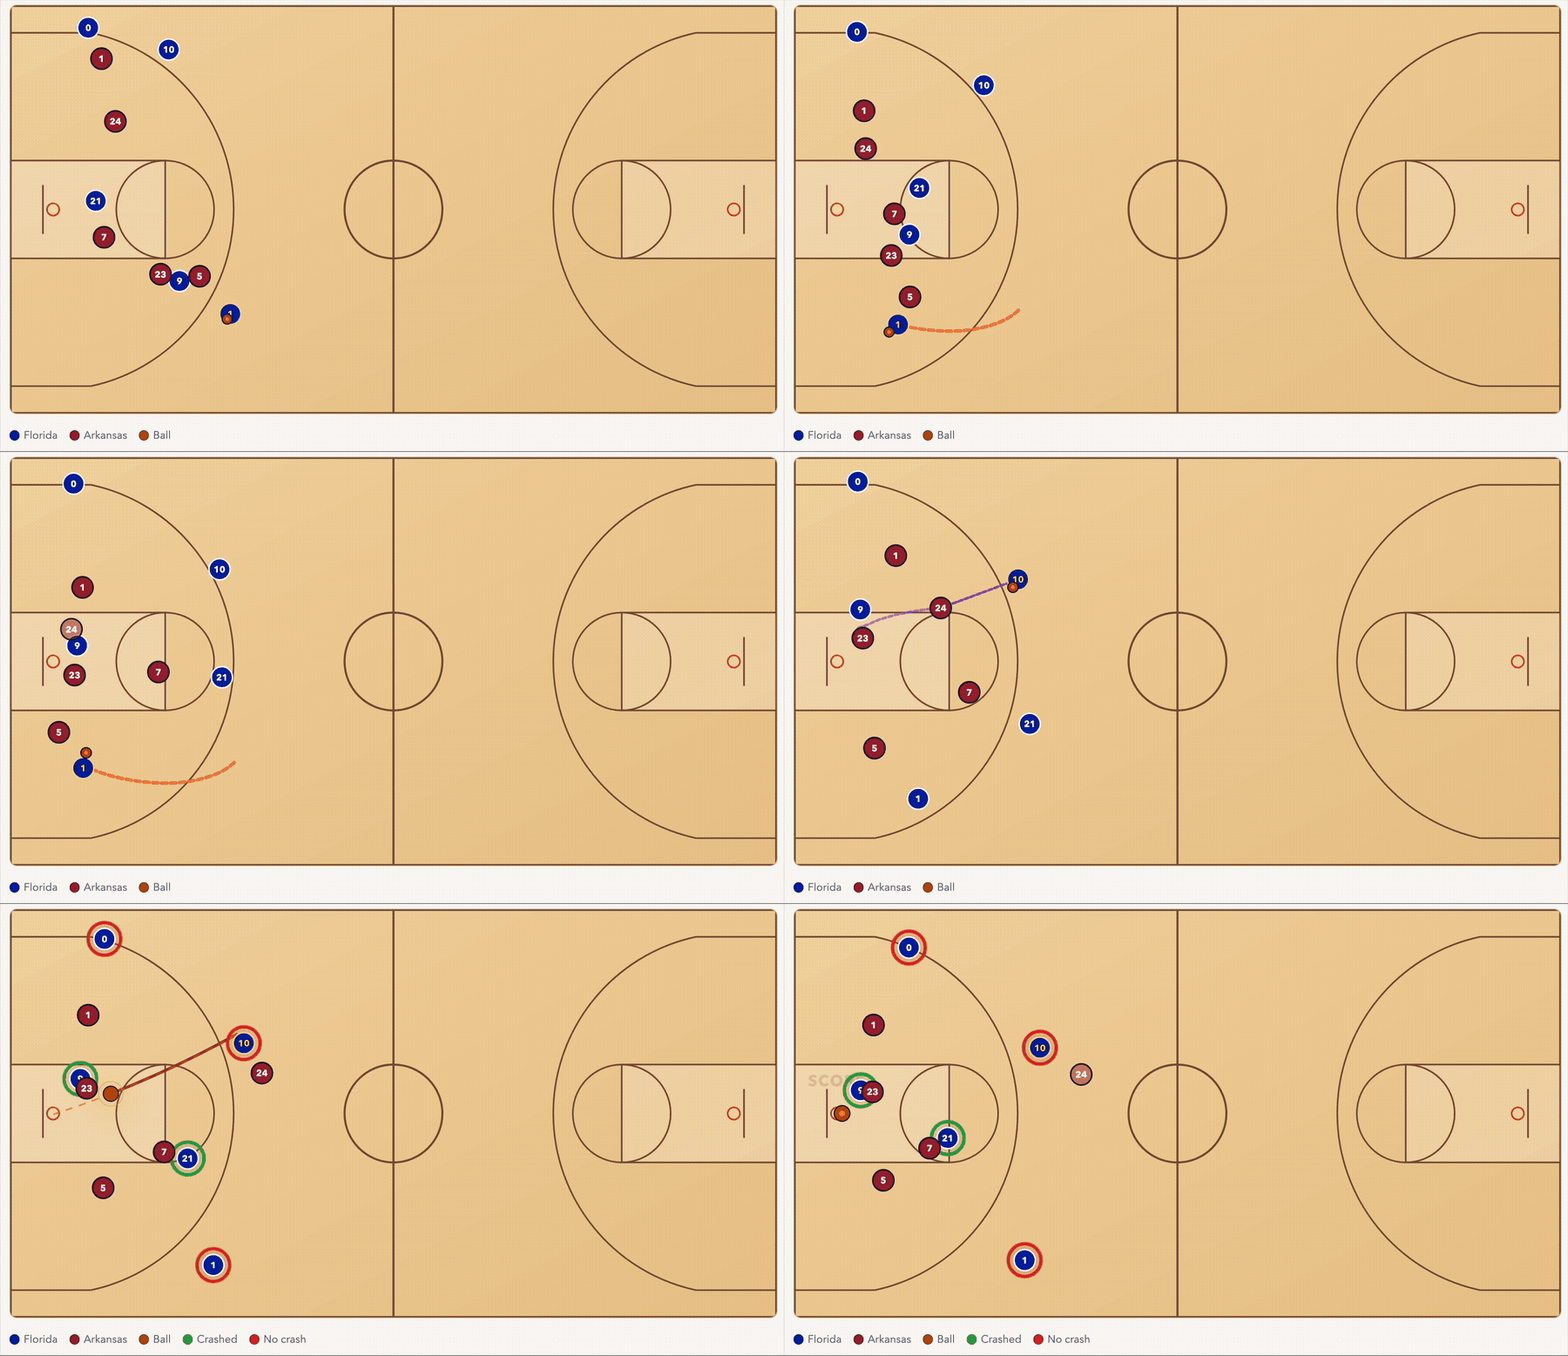
Before developing the model, we used SkillCorner dynamic event data to assist with the film review process. By filtering specific rebounding situations and possession characteristics, we could isolate the plays most relevant to our analysis rather than manually searching through full games. This is a process we have used across several of our projects, leveraging SkillCorner event data to reduce our film review to specific basketball actions instead of full games.
After reviewing the film, we allowed the tracking data to speak for itself. We examined how players moved toward the basket across possessions and developed a simple model to classify whether a player crashed. Rather than forcing a complex definition onto the data, we selected straightforward movement-based parameters that best aligned with what we observed on film.
When validating the model on an Arkansas–Florida game, the automated classification correctly identified crashing versus not crashing on approximately 257 of 265 (97%) player instances.
Measuring the Decision to Crash
Once every offensive player’s crashing behavior could be classified on every shot, we were able to attach crashing numbers to SkillCorner rebounds event data frame.
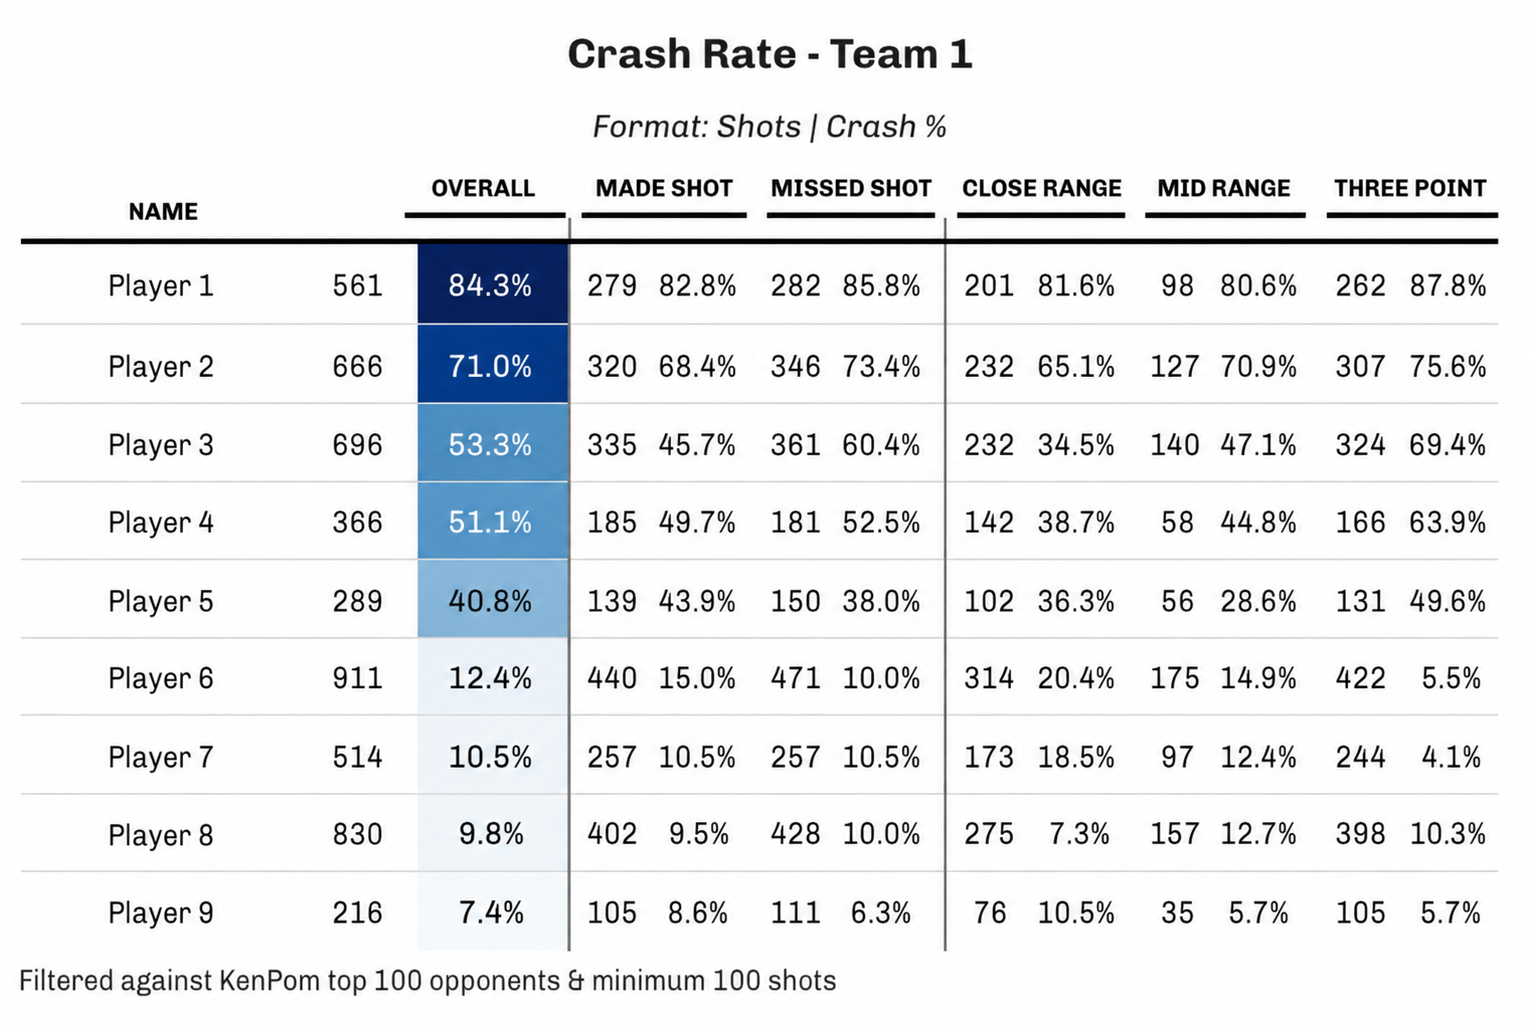
For each player, we calculated the overall crash rate and examined how that rate changed based on shot outcome and shot location. The report separates crash rates on made and missed shots and further breaks down crashing behavior on three-point, midrange, and around-the-rim attempts, resulting in a better understanding of the frequency that each player crashes for our upcoming opponents.
Measuring Crash Success
The next step was determining what happened when a player crashed. We created two success metrics: the first measures the team's offensive rebound percentage on missed shots when a specific player crashes and the second measures the individual player's offensive rebound percentage when they crash.
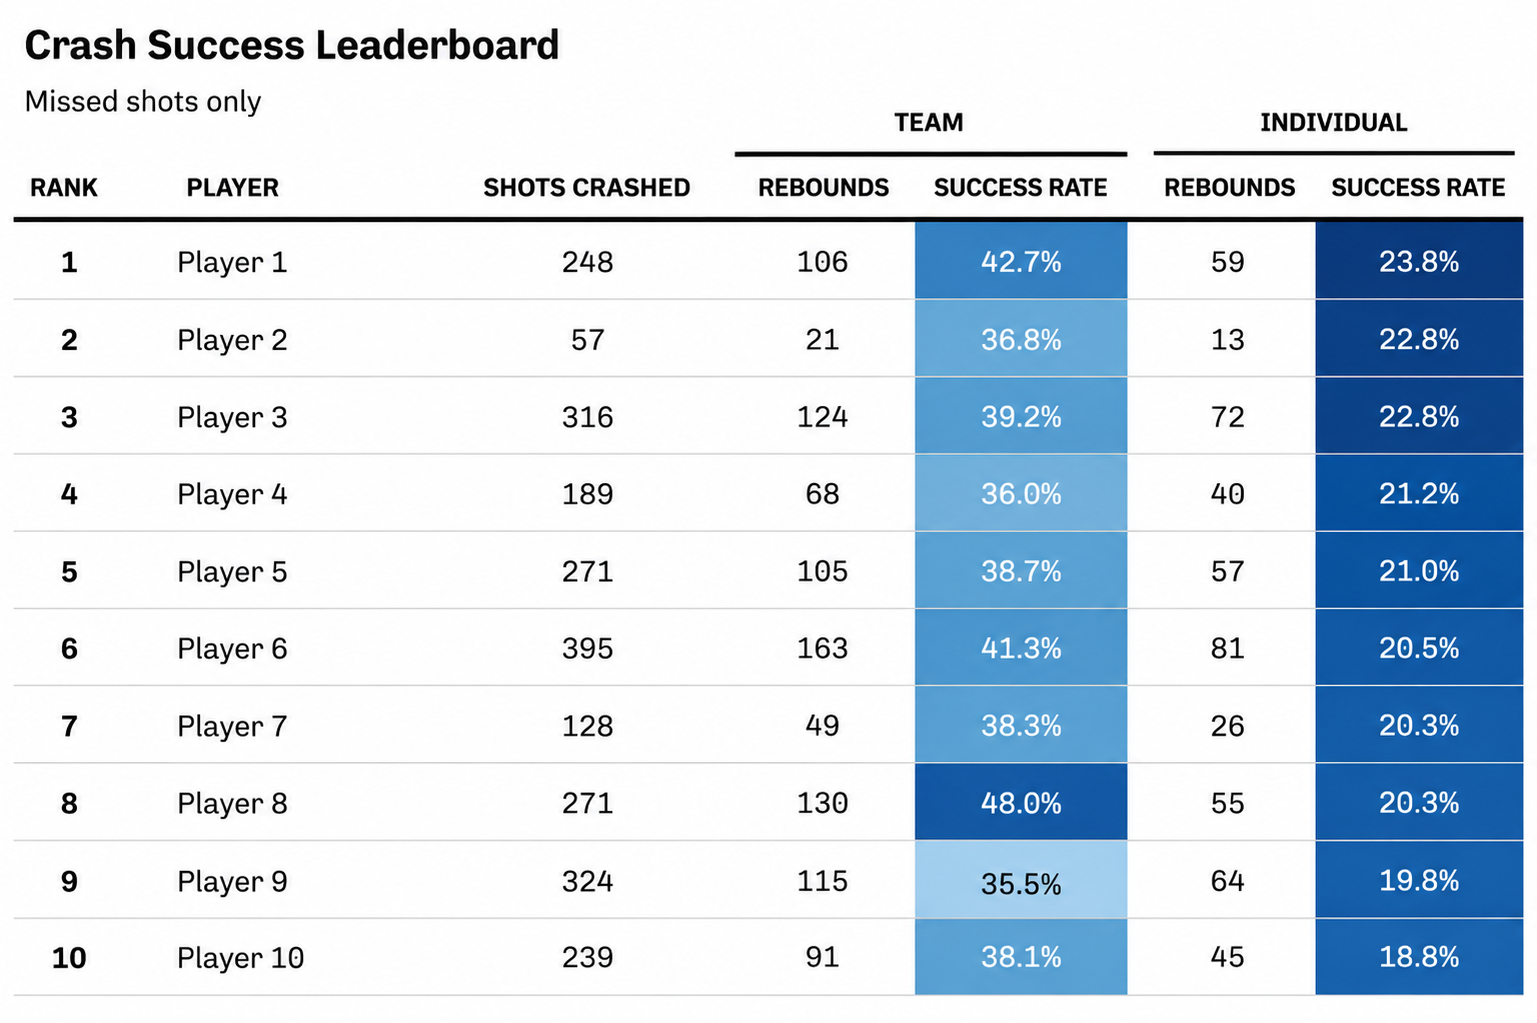
The distinction is important because a successful crash does not always result in an individual rebound. A player attacking the glass may create an opportunity that ultimately results in a teammate securing the rebound. By evaluating team offensive rebounding performance when a player crashes, we can begin to capture impact that traditional individual rebounding statistics may miss.
These two reports give coaches a more complete picture of a player's offensive rebounding tendencies. Two players may have similar offensive rebounding percentages but may reach those results in completely different ways. One player may crash on nearly every opportunity but convert a relatively small percentage of those attempts into rebounds. Another may crash selectively but be highly effective when doing so.
From Analysis to Coaching Application
The crash rate model has been incorporated into our reporting process with Florida Men's Basketball.
Coaches can view each player's overall crash rate, crash tendencies by shot type and outcome, and offensive rebounding success when that player attacks the glass. The analysis can also be filtered based on opponent quality and included in pre-game scouting reports.
We are also expanding the analysis beyond just our team and its opponents. A national leaderboard allows us to compare individual crashing behavior across college basketball and provide context for how a player's tendencies compare with players across the country.
What's Next?
The crash rate project represents one example of how we are using SkillCorner tracking and event data to measure actions that have traditionally been difficult to quantify.
An interesting step further in this analysis is understanding the relationship between crashing and transition defense. Sending additional players toward the offensive glass may increase offensive rebounding opportunities, but it may also create vulnerabilities when possession changes.
More broadly, the two-dimensional court model we developed provides a framework for analyzing other spatial and movement-based basketball questions. We can use the same tracking data to assist in studying spacing, screening, cutting, defensive positioning, and other off-ball actions that are difficult to capture through play-by-play or box score data.
SkillCorner tracking data has allowed us to move beyond measuring what happened and begin studying how and why it happened. For offensive rebounding, that means looking beyond the rebound itself and starting with the first step: Who crashed?
From Broadcast Video To Competitive Advantage
Everything in this case study runs on SkillCorner's AI-powered broadcast tracking. No in-venue hardware, no wearables: just the game footage teams already have, transformed into player tracking and Dynamic Events data covering drives, dribbles, closeouts, shots, rebounds, and more. That is what makes questions like “who crashed?” answerable at scale, across every player, every shot, and every opponent.
Want to see what SkillCorner data can unlock for your program? Get in touch with us today.
.png)