Our Most Advanced Physical Data Yet
Deeper physical data for smarter decisions, including splits by phase of play, Elite Sprints, and our new Physical Events.
We're proud to unveil the latest evolution of SkillCorner Physical Data. Shaped by years of expertise and innovation, this new release greatly increases the granularity and flexibility of our physical data, whilst also increasing overall accuracy and consistency.
The headline additions are:
- New Metrics: Splits by phase of play and 15-minute intervals
- New Metric: Elite Sprints. A new category of sprints, encompassing elite physical efforts.
- Physical Events: action-level physical data for visible high-intensity running actions, high and explosive accelerations, changes of direction and peak velocity.
- Main Referee Physical Data.
- A new Physical Quality Index that provides autonomy in deciding which data to ingest or discard.
Watch our explainer video below to learn more about these exciting new additions to our physical offering and how they can be applied in practice.
Or read on for the full details of the new release.
Explainer Video
New Physical Metrics
Until now, our physical data could be broken down by match, period (first and second half) and in/out of possession. This release goes further, adding two new dimensions: Phases of Play and 15-minute time bands. Alongside them comes an entirely new metric, Elite Sprint.
Physical Output by Phase of Play
Splitting by phase of play shows the tactical context in which a player produces their physical output. Two players who look very similar on average can prove to have quite different profiles once their numbers are broken down by phase.
Dodô and Josip Stanišić are a clear example. The two full-backs record almost identical Sprint Distance per 90 minutes, yet how they accumulate it is quite different.
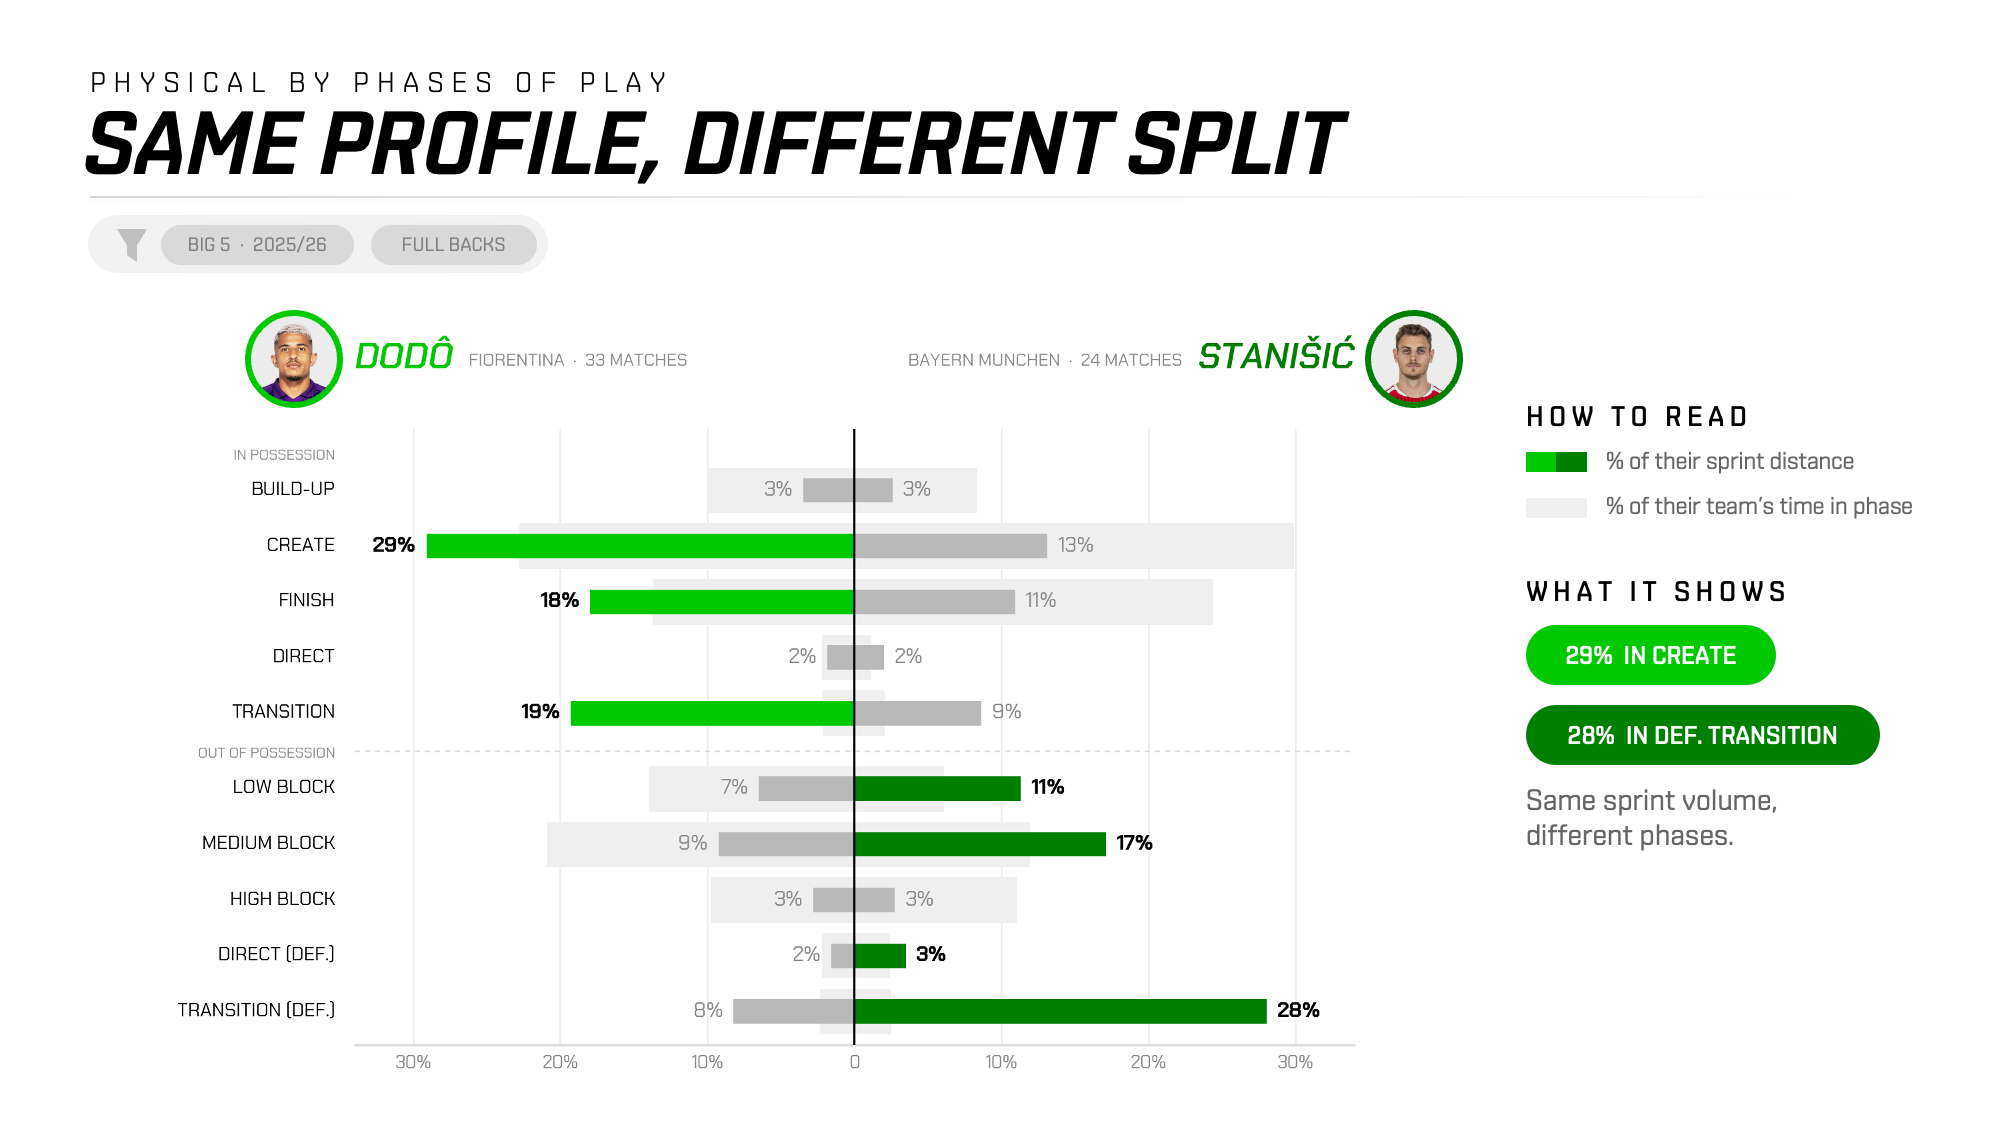
The attacking Create phase is where Dodô records most of his sprints, whereas for Stanišić, it is in Defensive Transition. This is key additional information that can help you profile potential signings based on the tasks they are expected to carry out.
Physical Output by Time Band
The 15-minute time-band split adds detail on when a player’s physical outputs occur. Returning to Dodô and Stanišić, two high-quality sprinters with similar overall numbers, the data shows them peaking at different moments in their matches.
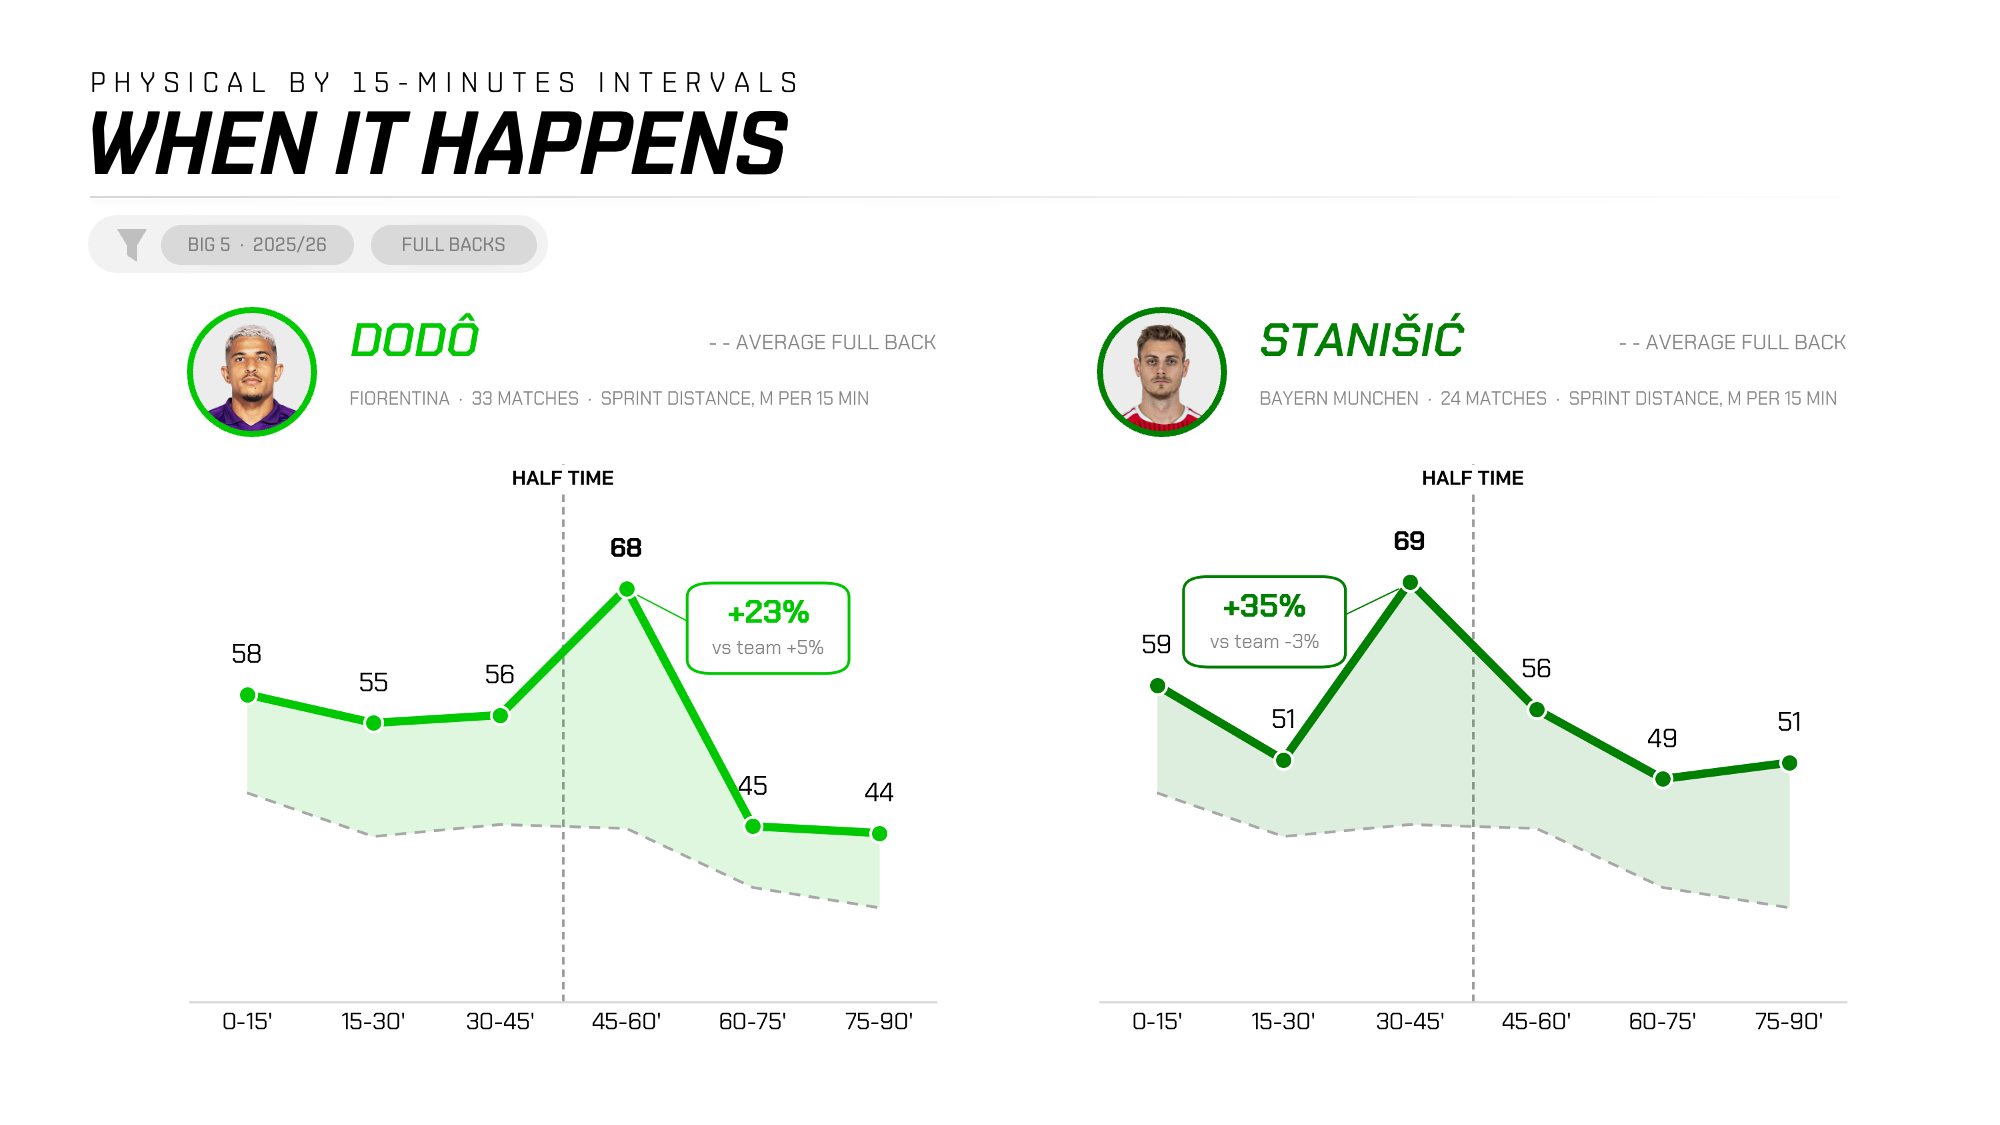
Dodô tends to peak shortly after half-time and trail off thereafter, whereas Stanišić peaks just before half-time and maintains a steadier output in the second half. While tactical context clearly plays a role in how players modulate their output, there is value in seeing where peaks and troughs occur and in identifying players capable of consistently maintaining physical performance over the course of their matches.
Elite Sprints
Two players can cover the same Sprint Distance at very different speeds, and that distinction matters. Our new Elite Sprint metric captures that, recording only the efforts above 30 km/h for men and 27 km/h for women.
The chart below shows the effect: a group of full-backs who rank similarly for Sprint Distance per 90 separate out once measured by Elite Sprint Distance.
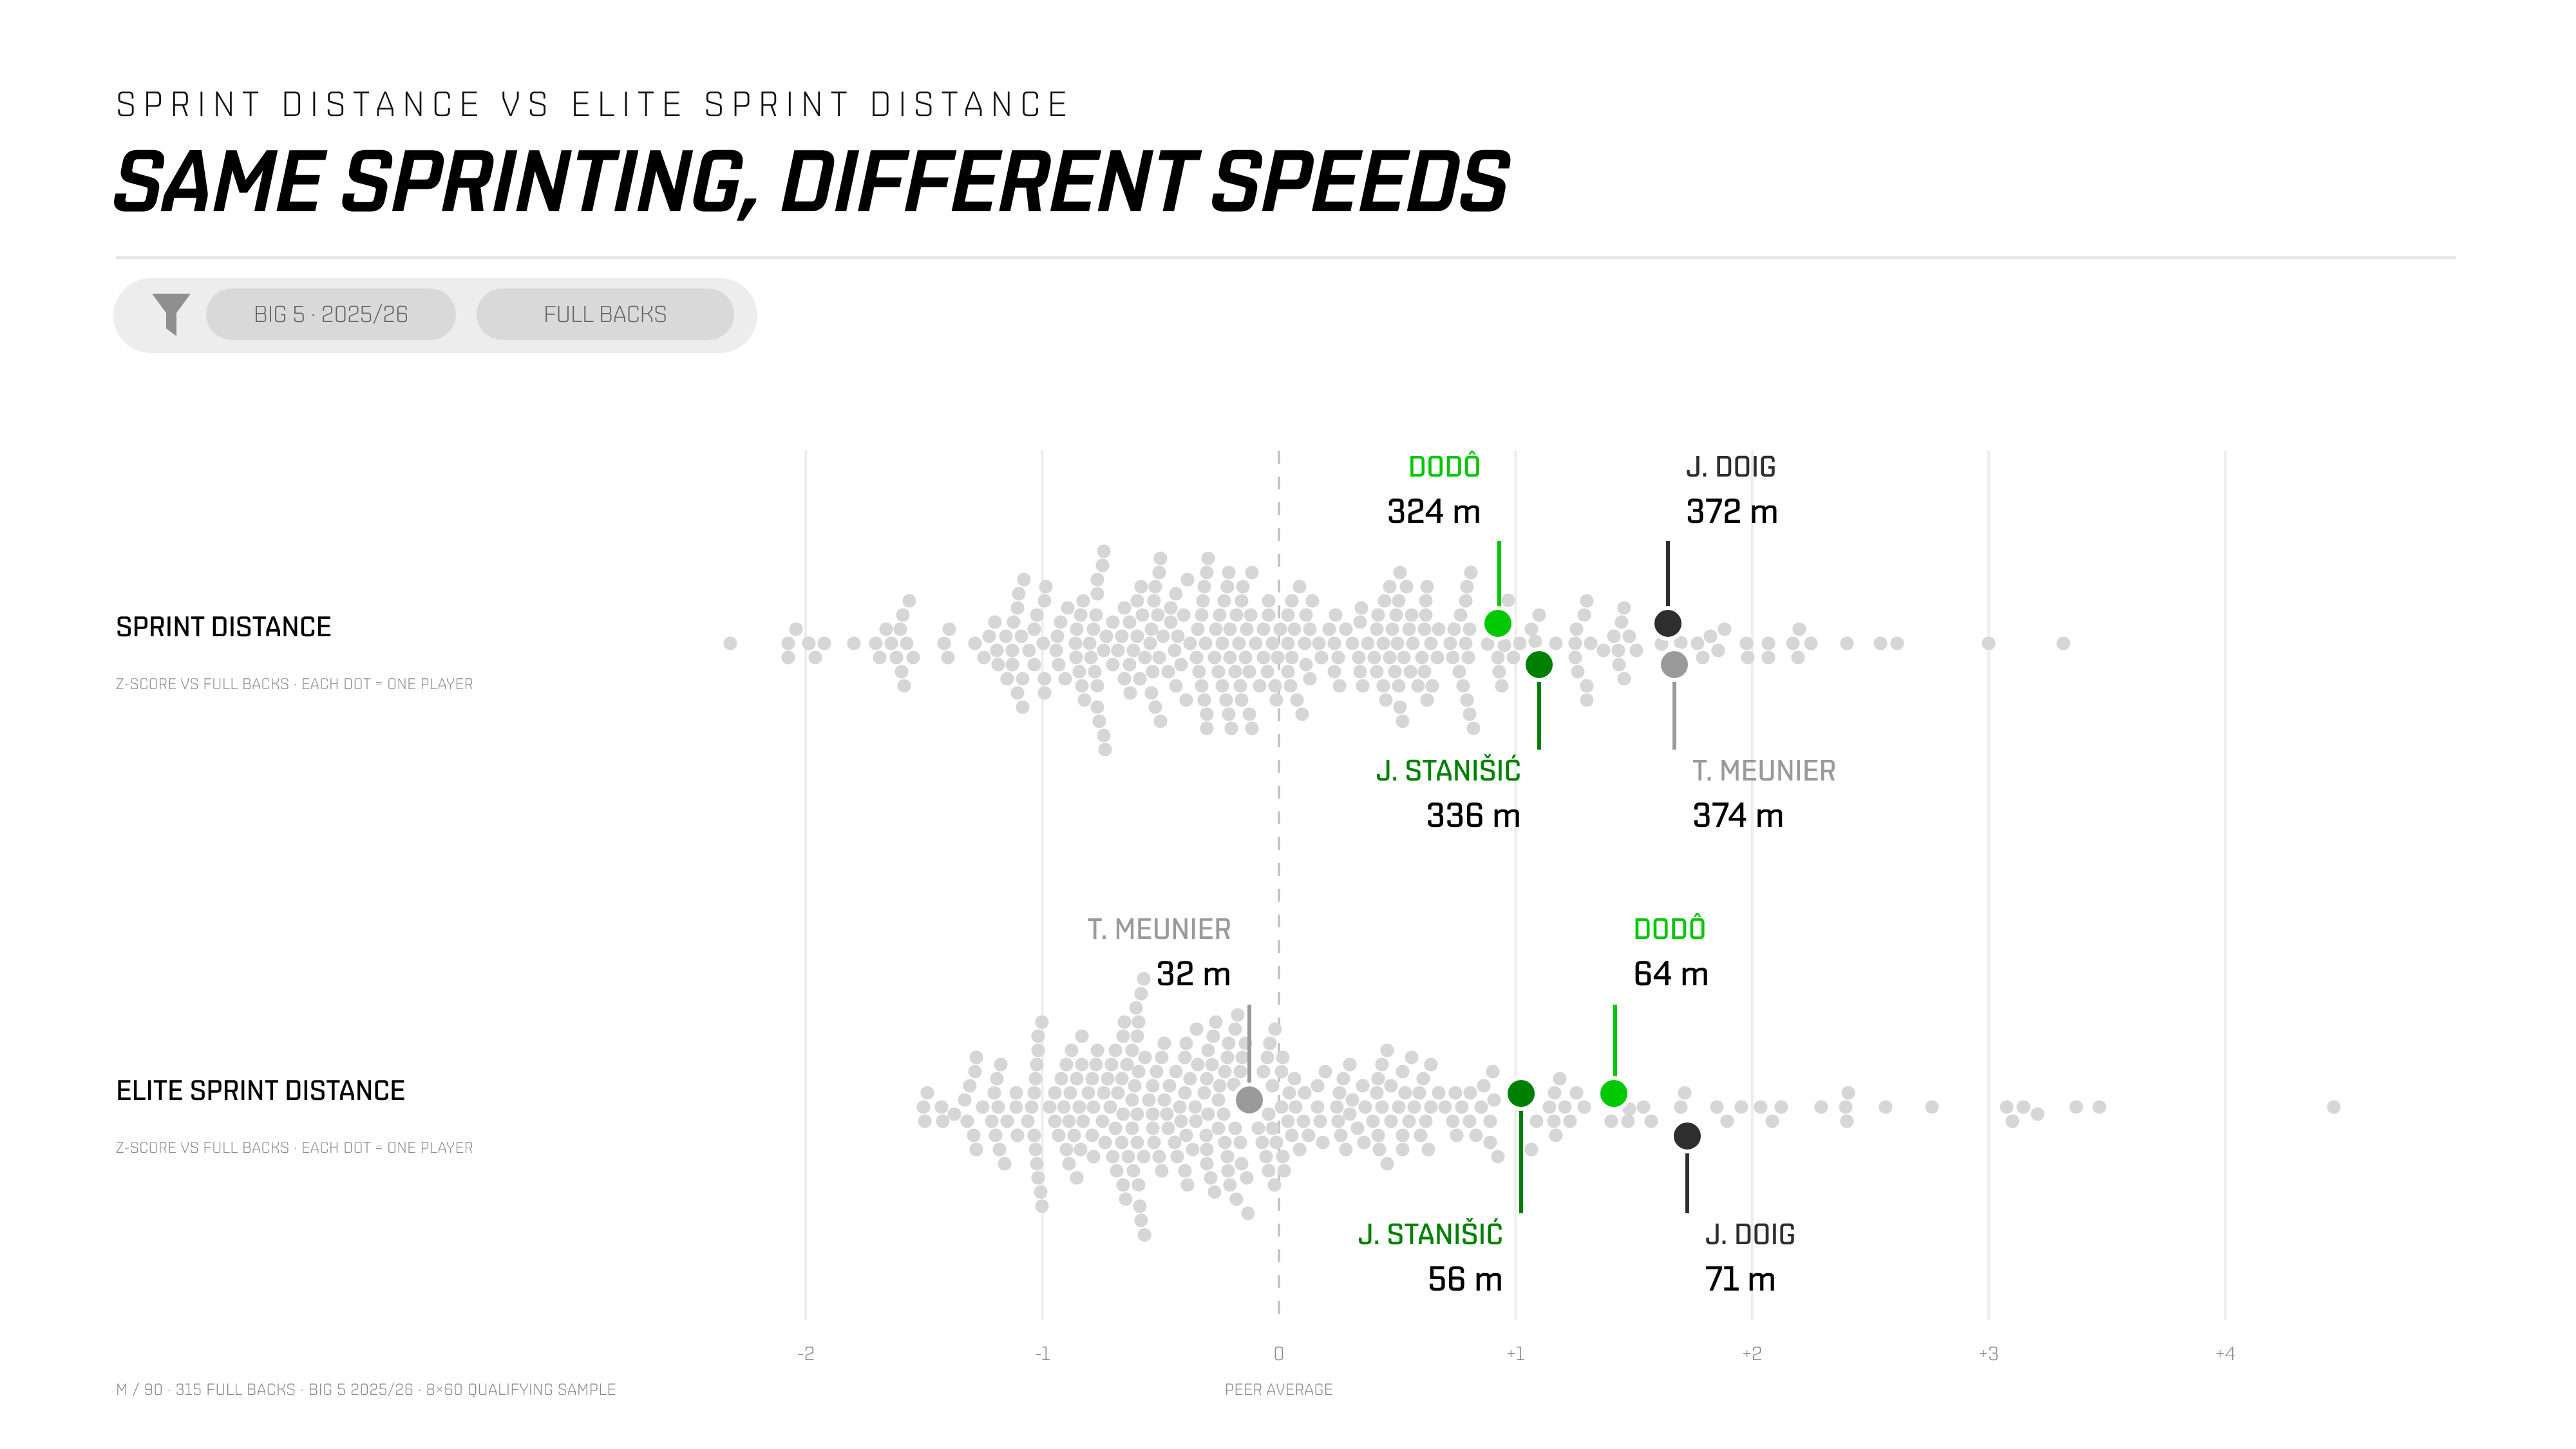
We have received feedback from numerous customers that an additional sprinting speed band would be valuable for them, and we are now able to provide that extra differentiation between standard sprints and an elite threshold.
Physical Events
Where our physical metrics aggregate performance, Physical Events drill down to the individual action: every high-intensity running action, high and explosive acceleration, change of direction and peak velocity output that are visible on camera.
Plotting the individual Elite Sprints of Dodô and Stanišić completes the picture built up so far, showing a clear split between the situations and pitch zones in which they complete their highest-intensity actions.
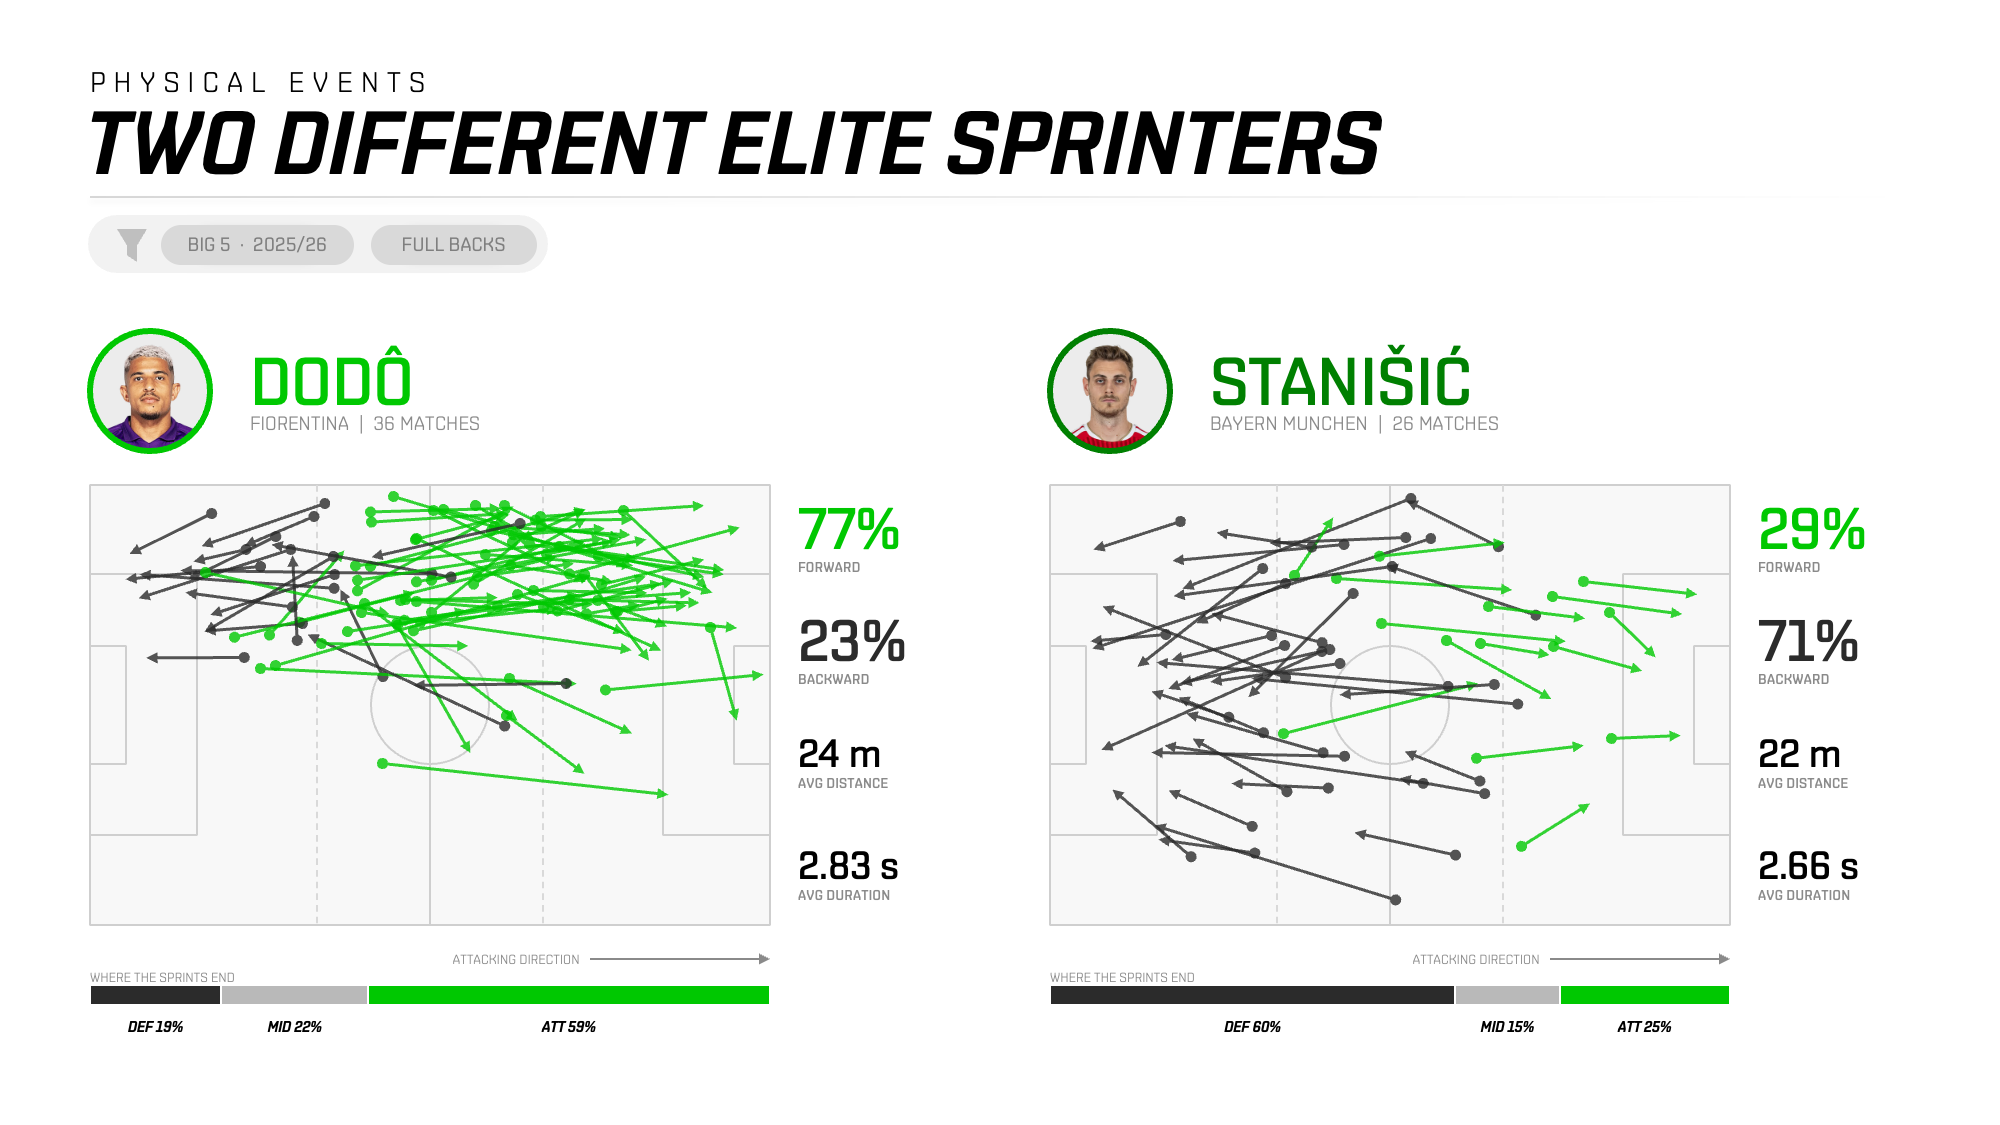
And because every event is now recorded and timestamped, it is easier than ever to connect physical actions to video to verify with your own eyes.
Connecting Physical Events to Dynamic Events
One of the most significant additions in this release is the possibility to link Physical Events with the Dynamic Events from our Game Intelligence solution, connecting physical outputs to their technical and tactical context.
Take player possessions by wide attackers. We can now investigate what lies behind a player’s high-value carries — those with an Expected Possession Value (EPV) possession delta above +1% — not only technically and tactically, but physically, too.
Some wide attackers generate that value by driving the ball at speed into space; others by unlocking a low block with close ball control. Each type of carry demands, and follows, a very different physical output.
Victor Muñoz and Lamine Yamal illustrate the point. Both record a high average EPV per possession, and a high number of high-value possessions, but they create that value in very different ways. Most of Muñoz’s high-value carries involve high speed, while Yamal generates dangerous situations through regular changes of direction.
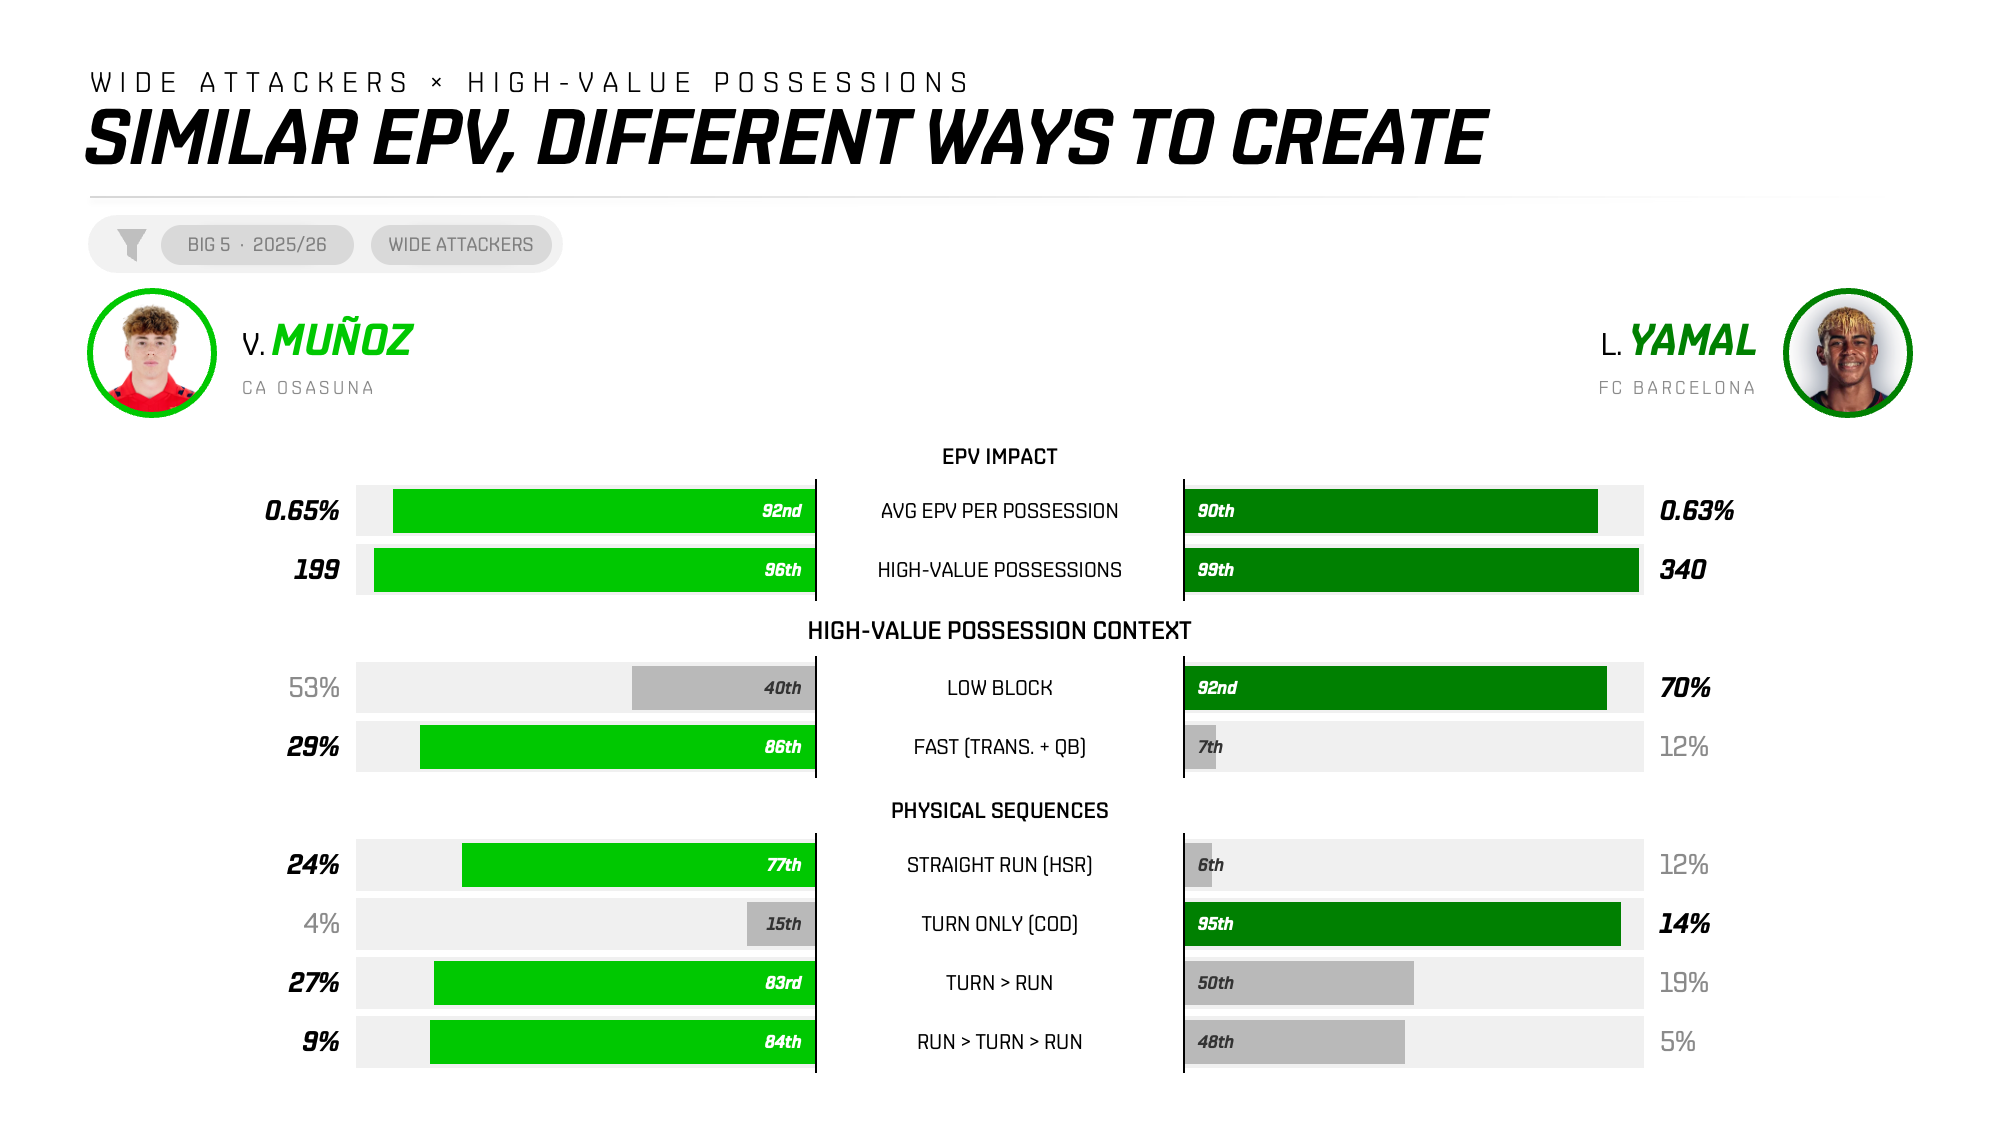
This type of analysis scales to other positions and actions, providing you with the data you need to investigate the relationship between physical and game outputs.
Why It Matters: From Averages to the Detail
With this release, we have greatly increased the granularity of our physical data, providing a depth of information and insight not previously seen at this scale.
For scouting and recruitment, the new metrics and Physical Events help separate players who share the same average profile, identify those physically built for a specific game model, and highlight the elite sprinters previously hidden amongst the average.
For match analysis and research, it means seeing where and when physical output actually happens and peaks, tying every effort to its tactical context, and going from a number on a page to the clip of the action itself.
How We Built It
The latest version of our Physical Data leverages the improvements in our upgraded underlying tracking data to provide a more robust and flexible pipeline that allows for the delivery of the more granular physical data included in this release.
The key improvements are:
- Enhanced visual descriptors: Improved differentiation of players and team, meaning more players are identified and associated with the correct identity.
- Better homography: An enhanced model, leading to better 3D real-world coordinates estimation from the 2D image.
- New Tracking model: Frame-level position, speed and acceleration values, including predicted error on position and speed, allowing for improved detection of physical actions, and the ability to precisely filter out unreliable movements.
- New Tracking pipeline: Computation of possession and phase of play values in tracking to provide consistent splits across all of our products.
These upgrades have not only powered the new metrics and data points, but they have also increased the accuracy of our existing suite of physical metrics. Across a range of speed-band metrics, the improvement versus ground truth from the previous version (V3) to this new release (V4) ranges from 9 to 37%.

And that improvement is evident both in and out of possession:
We have also reworked our methodology for acceleration-based metrics to align with the approach used for runs, delivering more stable outputs that correlate more closely to ground truth.
New Physical Quality Index
As part of these improvements, we have also updated the way in which we assess the quality of the physical data produced from each player performance.
Previously, we used a binary pass/fail check, with data not delivered for performances that failed. We received feedback from various customers that they would like more control over which performances they chose to ingest or discard, and so we have leveraged the new frame-level error predictions from our upgraded tracking data version to rebuild the quality check into a Quality Index.
The index runs from 0-6 and gives you a more precise view of the data quality of each player performance. Only performances with quality scores of three and above are included in the physical data aggregates we provide, but you now have the ability to ingest performances that don’t meet that threshold if the data is still valid for your use case.
Get Started
The new metrics, Physical Events and all other elements of this new release are available now to existing SkillCorner Physical Data customers.
Interested in adding physical insights to your own scouting process? Get in touch today.