


Shot Quality Series: A Player Season In Numbers
One Destination, two different paths

A Story Of Two Players’ Season Through Numbers
January 31st 2026. An analyst opens the EuroLeague stats page and notices that two players are performing similarly. Jean Montero, the lead guard of Valencia Basket and Tarik Biberovic playing on the wing for Fenerbahçe. They are respectively shooting 36.9% and 39.2% for the season so far. Their shot quality is almost identical: 37.4 and 37.2. Both seem to be struggling.
Winter passes and here comes spring. The sun is shining on our two players. Our analyst opens his stat page again and realises that since then our players are now shooting close to 50%. The observation is simple, they were in a early-season slump, end of story.
Not quite, the destination is the same but our players went through two very different journeys to get there. One of them was getting better shots. The other was making the same shots but better.
The Box Score Sees The Outcome. It Can’t See The Journey.
When we presented our Shot Quality model we explained a simple concept: every shot has a value before it’s made. Using our player and ball tracking, the model reads where the shot was taken, how much pressure was the shooter facing, how was the shot created. It then returns the probability that an average player makes that exact shot. This allowed us to look past a blurry number and identify what was based on shot quality and what was based on shot-making. In order to illustrate this difference we decided to track these two players from October to April and see what insight the model would give over a full season.
October to December, The “Slump” Or The “Drop-Off”?
The opening of the season wasn’t what you would call an ideal start for our players. From October to December, Montero shot 30.6% from the field and Biberovic 37.2% while the league as a whole was averaging 47.2%. When looking at their shot quality Biberovic was averaging 37.4 and Montero was having one of the most difficult shot diets of any perimeter player in the competition with 34.7 (5th percentile). Meanwhile the average shot in EuroLeague had a Shot Quality score of 43.4. Neither were close to the league standards and something needed to happen.
January to April, The “Climb”
The second part of the season yielded much better results and spring was looking bright for our players. They’d changed course and the finish line was clear in sight. Biberovic saw his FG% go from 37.2% in October to December to 50.0% in January and February and 47.1% in March and April. He climbed from 0.93 to 1.26 and 1.24 in points per shot. During that same period, Montero went from 30.6% to 47.2% and finished with 45.6% FG%. His point per shot also increased from 0.77 to 1.13 and ended at 1.04 against a league average of 1.10.
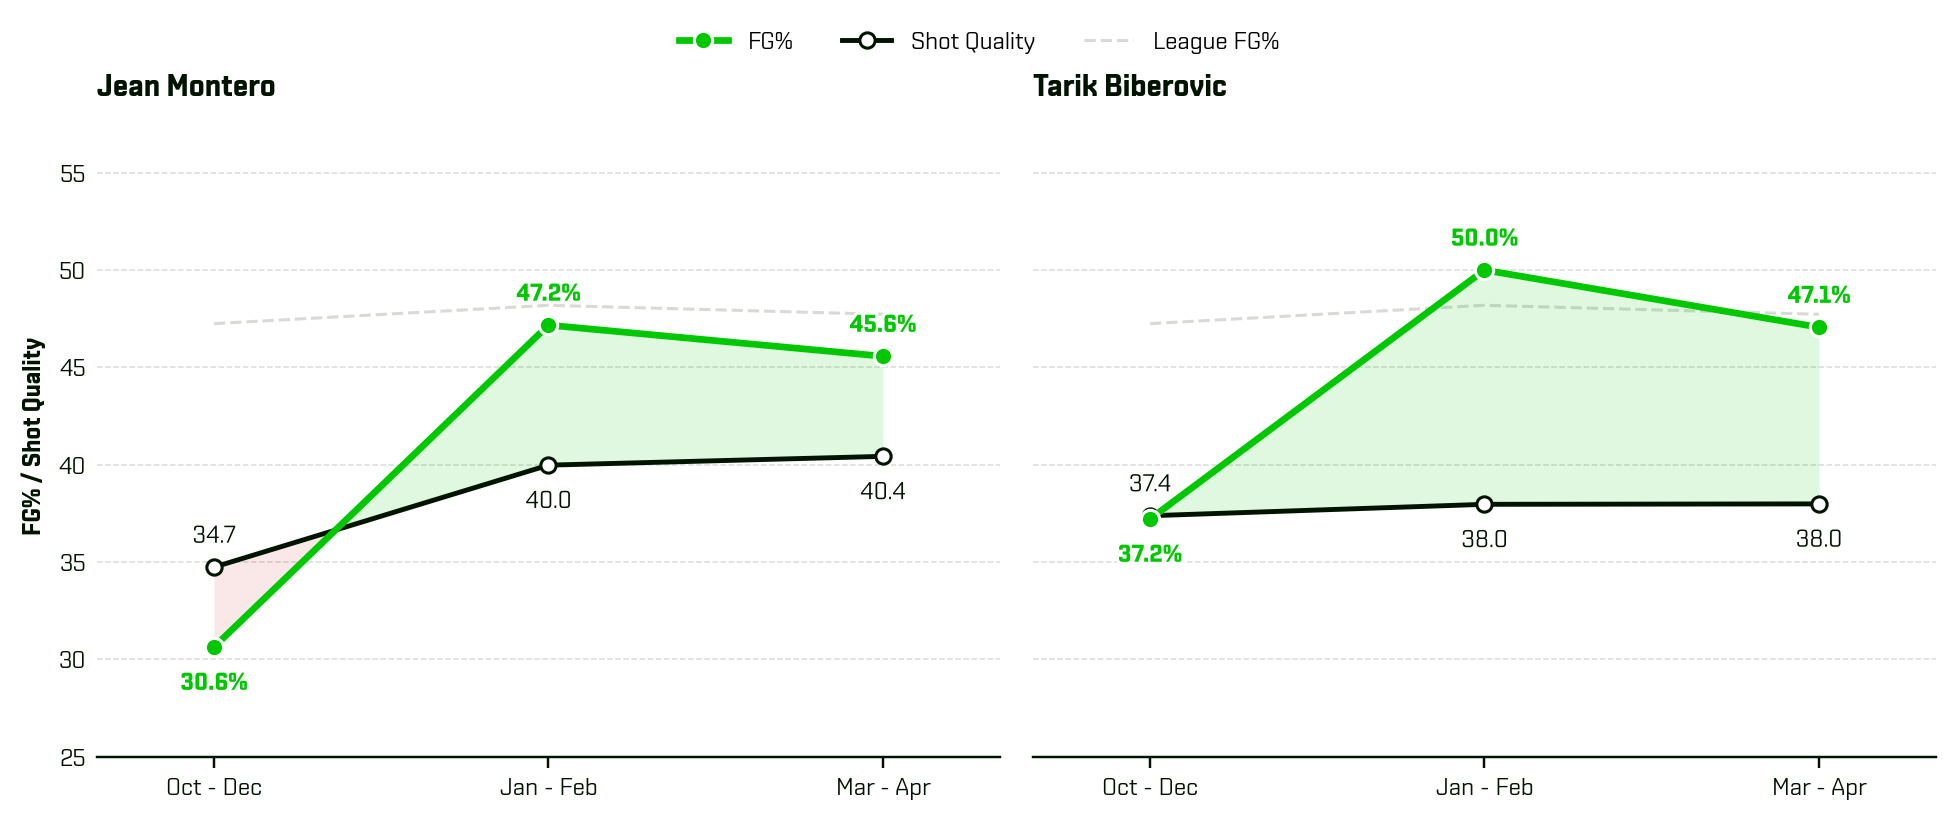
The green lines show the outcome. The Shot Quality lines tell us the journey.
Two Different Journeys That Lead To The Same Outcome
Montero's Shot Quality went from 34.7 (October to December) to 40.2 (January to April), the largest increase among the 77 perimeter players with at least 81 shots in both periods (the average change was +0.3). Among perimeter players, he moved from the 5th percentile in October to December to the 47th from January and February. His Shot Quality rose with a new shot profile: more attempts at the rim, fewer difficult threes. No other perimeter player improved his shots as much. And on top of better shots, he also made more of them.
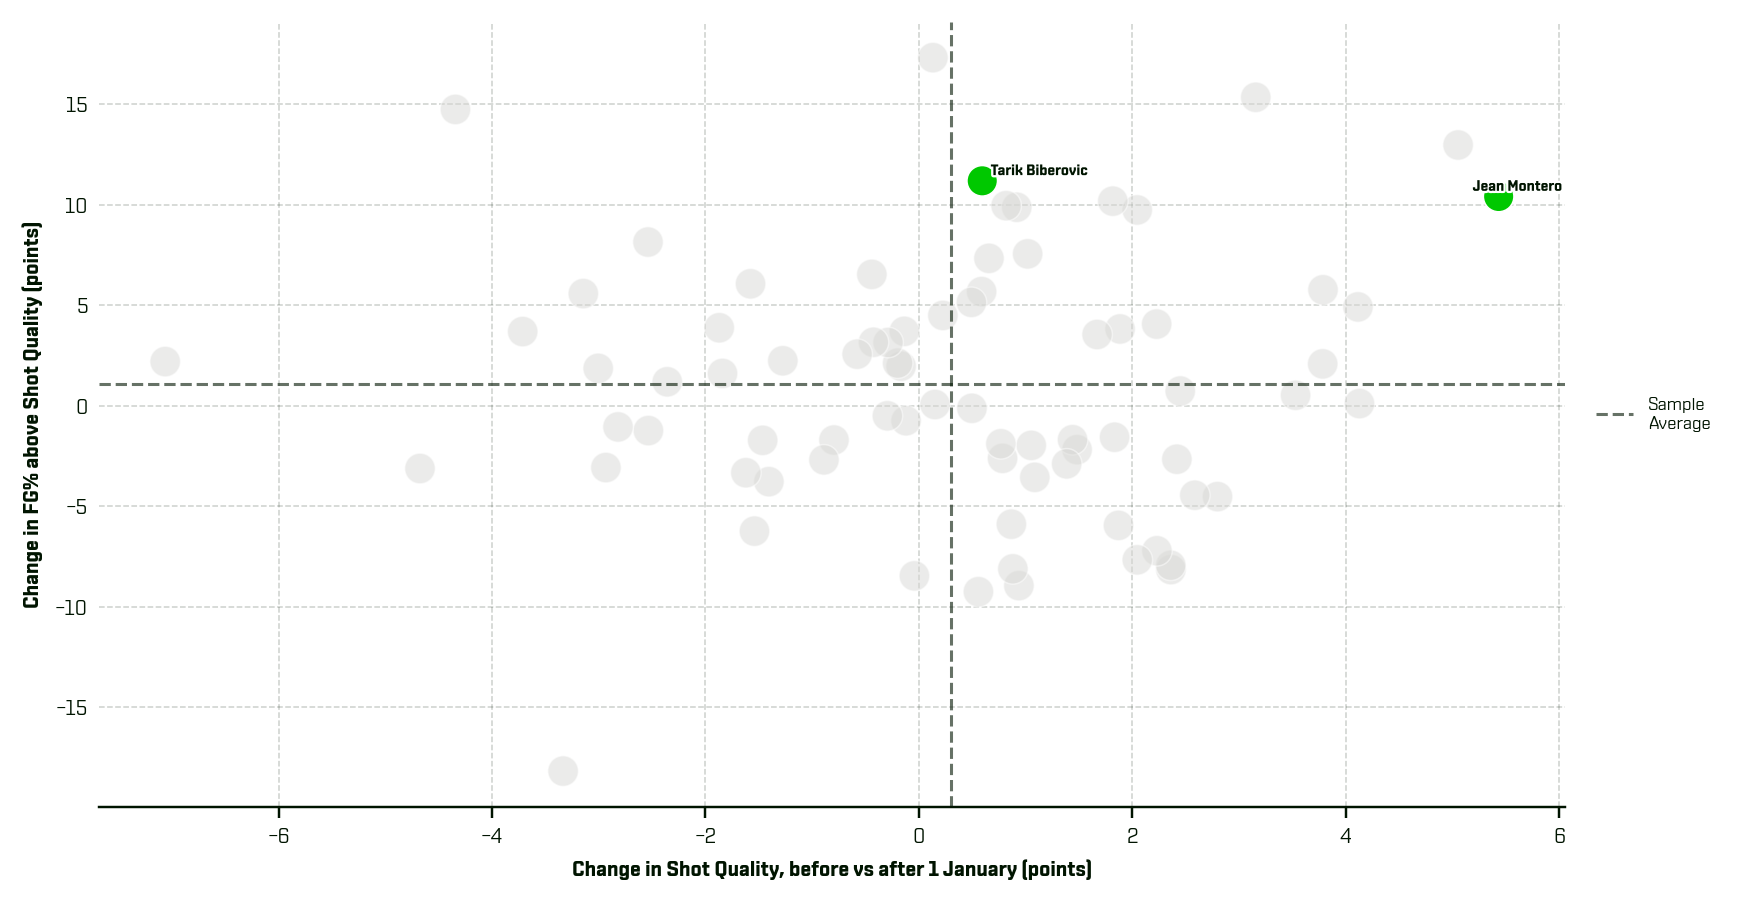
Biberovic’s Shot Quality barely moved, from 37.4 to 38.0. He kept taking the same shots. What changed was the conversion. Before January, his field goal percentage sat right on his Shot Quality (-0.2 percentage points). From January, it was +11.0 points above it, far beyond the league norm of about +4. Montero improved there too, from -4.1 to +6.3, but what sets him apart from the other players is the shots themselves.
Both players finished the regular season near 50% from the field after January 1st (46.5% for Montero, 49.0% for Biberovic). Montero adapted his shot profile. Biberovic found his shooting again.
Montero, A New Way Of Painting
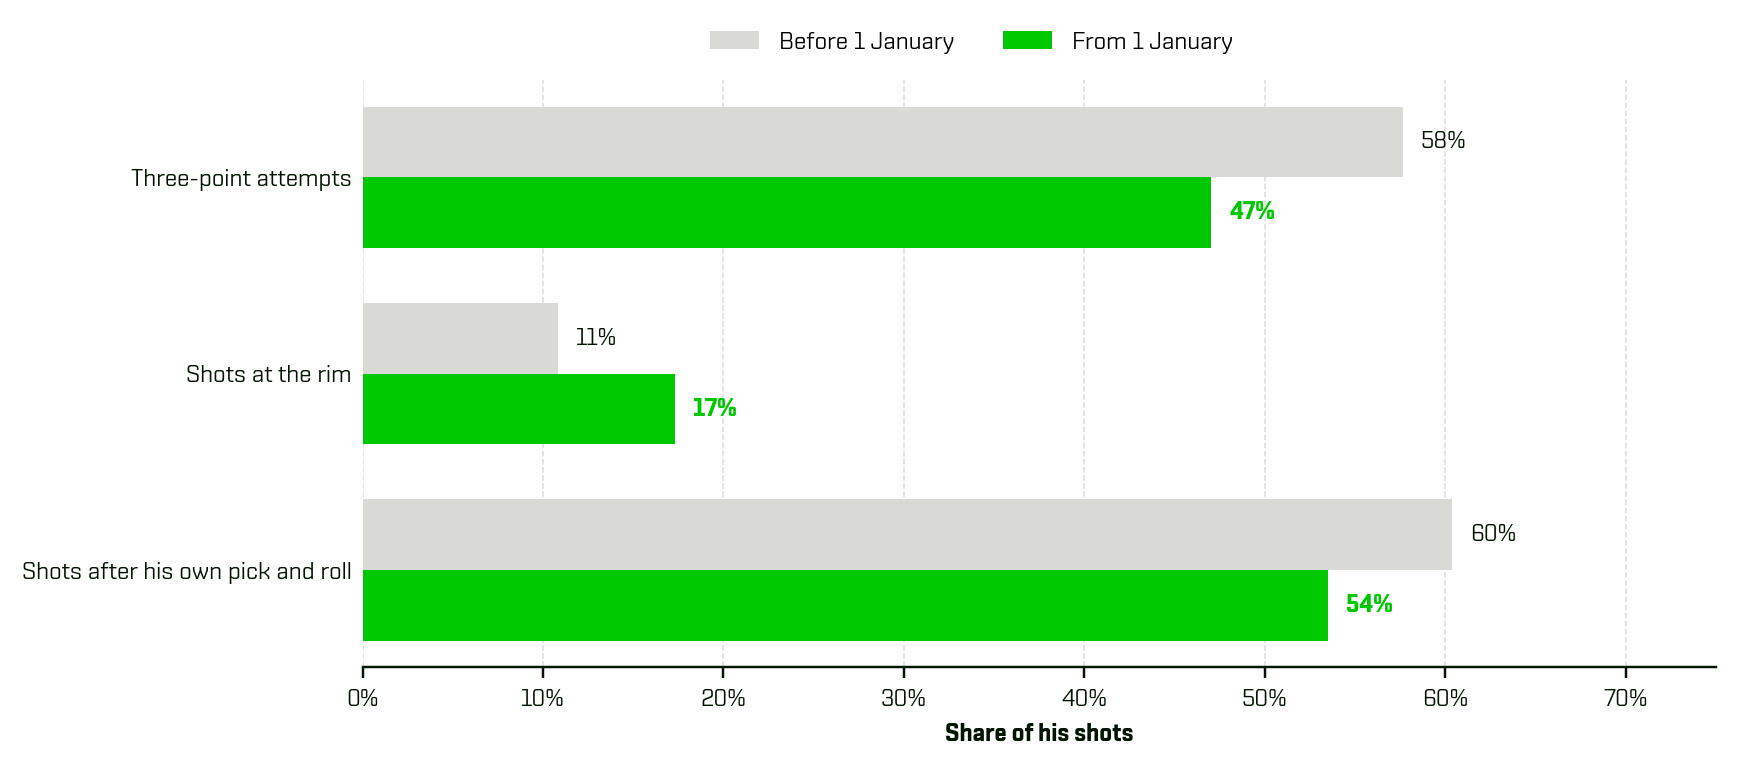
One of the biggest challenges and strengths of an athlete is his ability to adapt and evolve when the game requires. A clear example is Montero’s evolution across the 25-26 season. Rather than bashing into a wall, his team looked for the ladder that would get him over it. His evolution is shown in where his shots came from. Before January, 58% of his attempts were threes and only 11% came at the rim. After January the threes fell to 47% and his shots at the rim rose to 17%. A slightly smaller share of his shots came straight out of his own pick and rolls (60% to 54%). The brushstrokes on the canvas changed and another painting emerged.
Fewer threes, more shots at the rim: that’s how Shot Quality translates on to the court.
The trend carried into the playoffs. In the five-game series against Panathinaikos, which Valencia won after losing the first two games, Montero shot 57.1% on 49 attempts (smaller sample size) with an average Shot Quality of 42.0, higher than during the regular season, and 29% of his shots came at the rim.
Biberovic, Success Is Back On The Menu
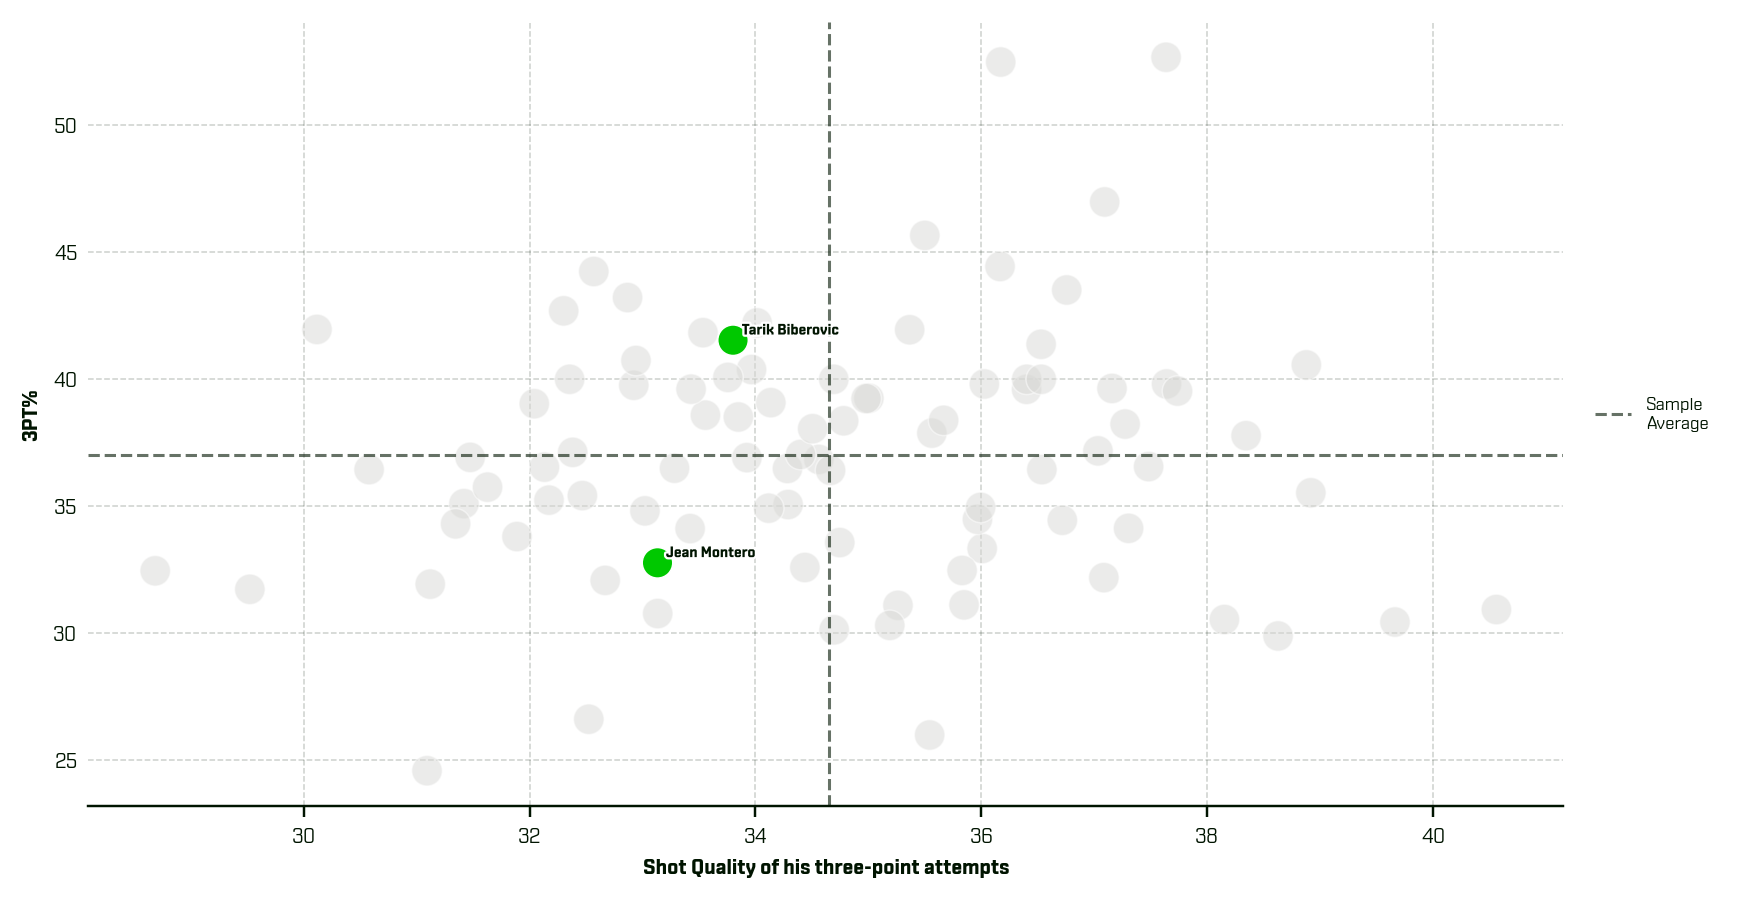
On the other hand, Biberovic shot profile barely changed. He wasn’t facing the same problem and that’s the whole point of this analysis. He stuck to his role and powered through the slump. Catch-and-shoot attempts went from 46% to 53% of his shots, and over the season he made 41.5% of his threes, with an average Shot Quality of 33.8. In comparison, Montero who had almost the same Shot Quality (33.1) for his threes only scored 32.8% of the time.
To better read the slump, you need to go back to the 24-25 season to understand that October to December was the exception. During that season Biberovic, with the same team, shot +7.4 points above the quality of his shots, while the league as a whole was at +4.5. From January, he went back to his usual level and even above it (+11.0).
What This Means For Teams
Box scores tell you WHAT changed. Shot Quality tells you that the process changed and leads to understanding HOW.
A large part of Montero's turnaround came from better shots. Valencia’s offense started creating better shots across the board (his teammates' Shot Quality also went up by about 2 points), and Montero took full advantage of this, trading tough threes for cleaner shots. Biberovic's story is different. He kept getting the same opportunities but started making them at the rate he did the season before. Same outcome on paper, two different journeys to reach it. Shot Quality is what tells them apart.
Both players are heading to new horizons in this 26-27 season. Montero is joining Olympiacos and Biberovic is heading to the Dallas Mavericks. Their new teams are signing two players who took different paths to the same numbers, and that’s exactly where Shot Quality makes a difference.
- For coaches, it shows whether the turnaround came from the system creating better shots or from players hitting the same ones. Therefore knowing if it’s a process you can build on or a skill you can count on.
- For scouts, it differentiates a slump from a decline. On paper you could have read Biberovic’s numbers as a decline, but the data from 24-25 showed that this was an exception.
- For analysts, it gives a better understanding of who you are signing. Olympiacos are getting a guard who played his best basketball when he attacked the rim more and settled for fewer difficult threes. Dallas is getting a shooter whose value lies in making ordinary catch-and-shoot threes at a rate well above the norm.
Journey Further with SkillCorner
Every season has a story the box score can’t tell. SkillCorner helps you read it. Get in touch to see how our tracking data and intuitive WebApp can sharpen your game analysis and scouting.